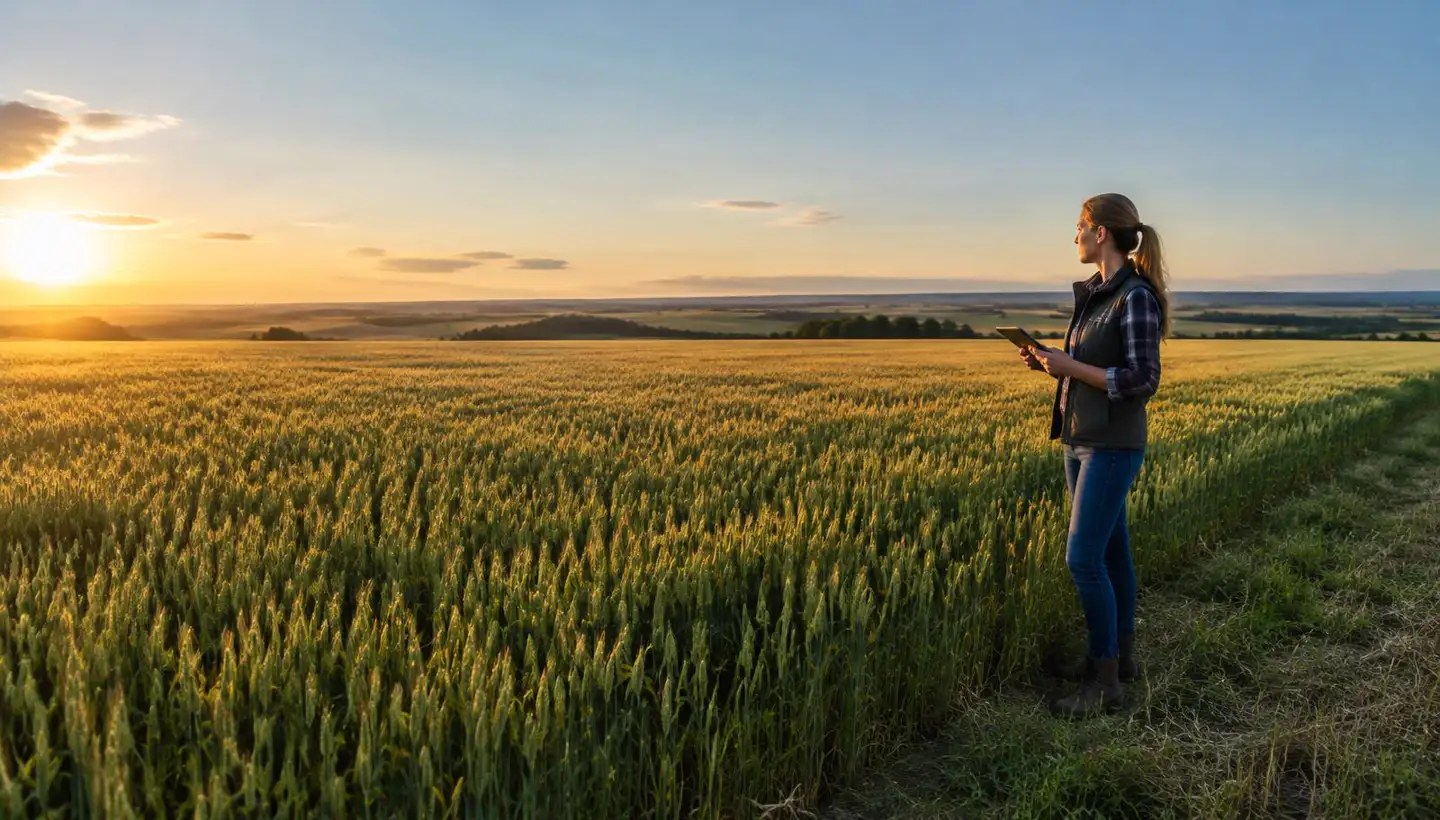
Technical support that scales.
Satellite Insights · Risk score · No sensors
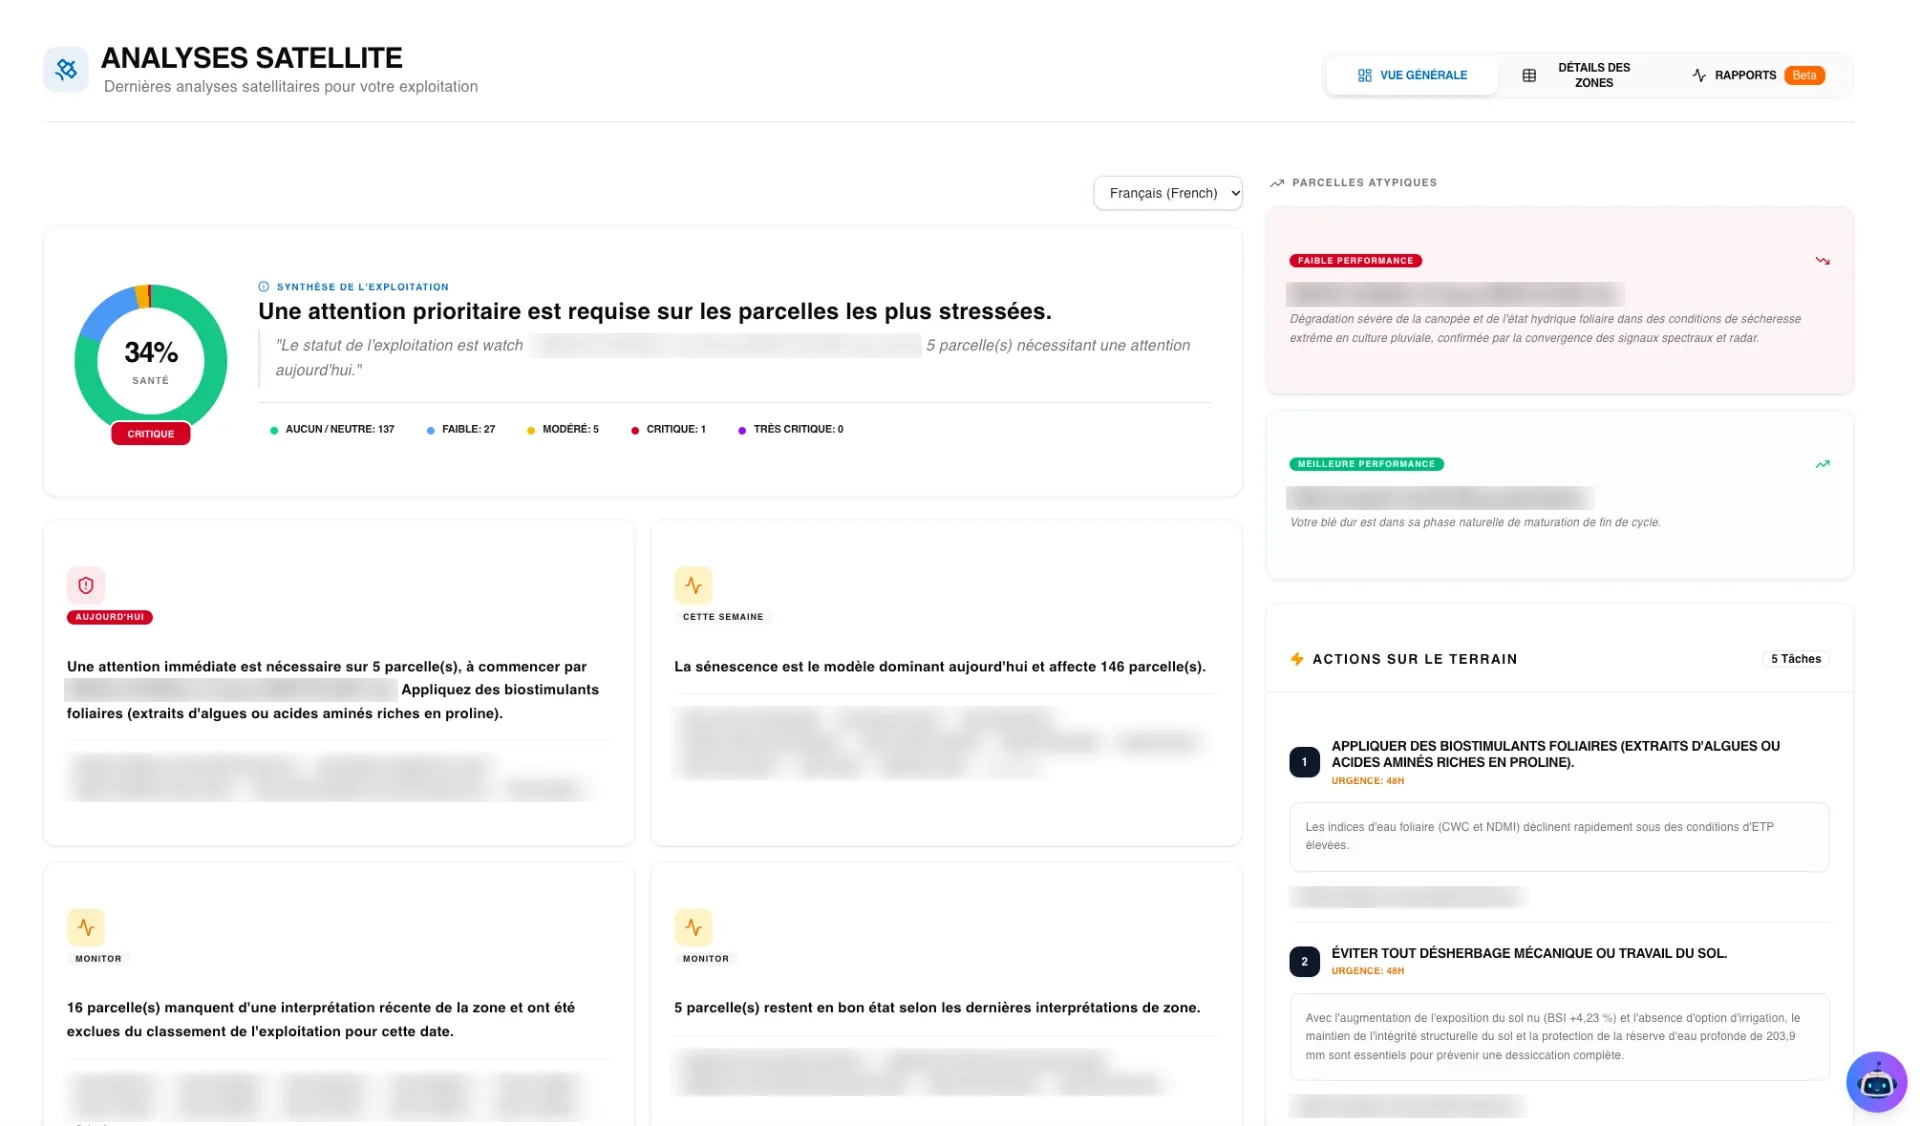
Satellite Insights reads every satellite image of every field in your network and surfaces only what matters: farms at risk, actions to take, advice to deliver. Your field teams cover more growers without lowering the quality of their advice.
16 to 40% water savings independently validated by the Loiret and Cher Chambers of Agriculture (Netirrig by Seabex).
Field advice doesn't scale on its own
Too many fields, too few advisors, signals seen too late.
Today
- One advisor covers dozens, sometimes hundreds of farms.
- Visits follow the calendar, not the risk.
- Stress shows in the infrared before it is visible to the eye: in the field, it is often spotted too late.
- Advice is hard to trace, deliver and measure.
With Satellite Insights
- Every field read at every satellite pass, with no sensor and no extra data entry.
- A risk score per field and per farm directs field visits.
- Early alerts and actions prioritised at 24 h, 48 h or 7 days.
- A dated record of every diagnosis and every piece of advice.
THE PRINCIPLE
Crop monitoring and technical support: one single service.
The satellite observes everything. Agronomic AI interprets everything. Your team only receives what needs a decision. The risk score links the two: it turns monitoring into a visit plan.
Illustrative example
Only what's urgent comes up.
METHOD
From satellite image to field action
01
Observe
Sentinel-1 (radar, sees through clouds) and Sentinel-2 (optical), 10 m resolution, new image every 5 days. Cloud masking, history available since 2018.
02
Interpret
31 spectral indices combined with weather, soil, crop and growth stage. Agronomic AI writes a report per field and per farm, with a 0 to 100 risk score.
03
Prioritise
Farms are ranked by risk level. Atypical fields are flagged. Every intervention gets a deadline: 24 h, 48 h or 7 days.
04
Act
Field actions written and ready to send. Advice goes out by WhatsApp or SMS, in the grower's language.
05
Build up
Every diagnosis and piece of advice is dated and archived. The risk score is kept at each interpretation: the field keeps its curve, the season its summary. Seasons can be compared year on year.
IN PRACTICE
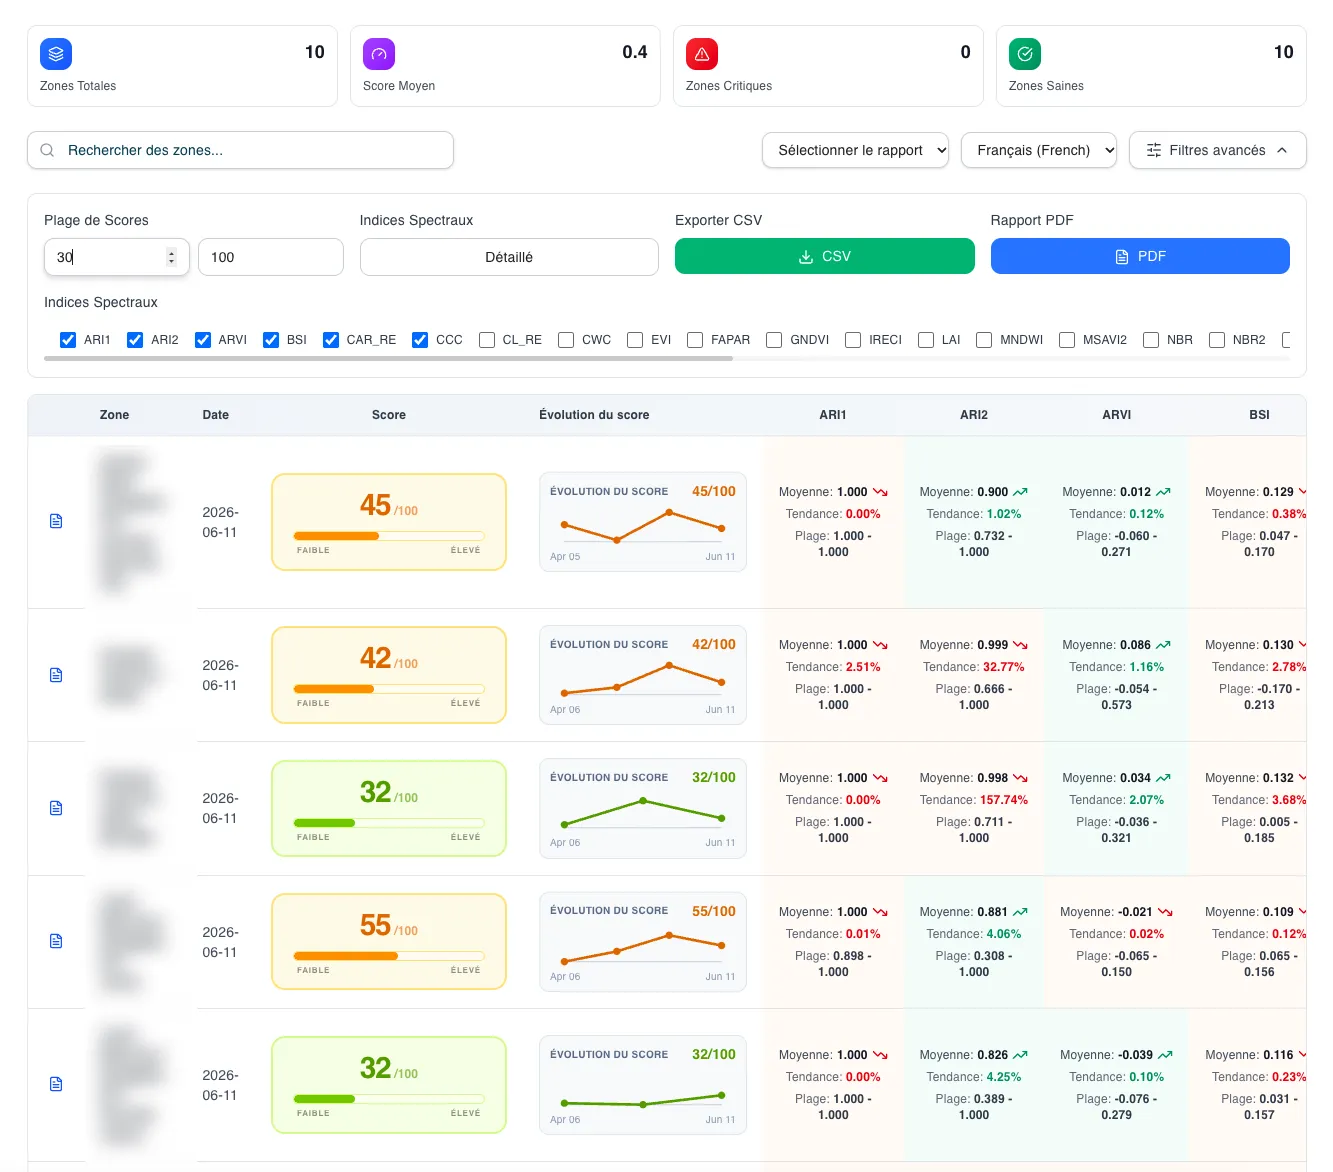
Which farms should you visit this week?
Compare a calendar-based round with a round driven by the risk score.
- EX-07Durum wheatCritical81Simultaneous drop in soil and leaf moisture over 60% of the areaVisit, check irrigation24 h
- EX-15OliveHigh72Signal consistent with a leaf disease, grower photo receivedConfirm diagnosis on site48 h
- EX-03PotatoHigh64Vigour dropping in the northern zoneCheck nitrogen nutrition48 h
- EX-22TomatoModerate55Rising in-field variabilityCall the grower, follow up next pass7 d
- EX-11Sugar beetModerate41Slight estimated water deficitIrrigation advice sent by message7 d
- EX-09Soft wheatLow28Normal senescence for the stageNo action, harvest expected within 10 days·
- EX-18MaizeLow22Development on trackNo action·
- EX-01BarleyLow15Development on trackNo action·
Illustrative example.
Field history
The score follows the field, interpretation after interpretation.
Every interpretation adds a point to the field's history: its score, the signals that moved it, the action advised. You can see what worsened, what improved and since when. At the end of the season, those points become a summary: what happened field by field, what was done, and what the next season should take from it.
EX-07 · Durum wheat
Risk score across the season
The moments that moved the score
- 4106 MaySoil moisture dropping, irrigation advice sent.
- 8130 MayMoisture drop over 60% of the area, visit within 24 h.
- 4511 JunScore falling since the peak, monitoring of the sensitive zone maintained.
Illustrative example.
Season summary
At the end of the season, every field's history is summarised: what happened, what was advised, what was done. The summary reads field by field, or across the whole network.
- 10
- interpretations
- 81
- peak score
- 2
- alerts raised
- 1 visit
- 2 pieces of advice sent
From 5 April to 11 June, the score rose and fell, peaking at 81 on 30 May before returning to 45. The water deficit was flagged on 6 May, two pieces of advice were sent to the grower and a visit was scheduled within 24 h at peak risk. The latest interpretations show improvement without erasing the critical episode. To watch next season: the northern zone, the most sensitive to water shortage.
Illustrative example.
Summary built from the field's history, in French, Arabic or English.
CAPACITY BUILDING
Advice reaches the grower. And the grower understands it.
Technical support only matters if it changes practices. Satellite Insights explains the why, speaks the grower's language and helps them progress season after season.
In their language
Advice by WhatsApp or SMS. Reports in French, Arabic or English. The Magonia AI agent answers in over 100 languages, included free.
It explains the why
Every recommendation rests on a readable diagnosis: which signals moved, since when, with what confidence level.
Disease diagnosis
Grower photos combined with satellite monitoring: 21 olive diseases and 13 date palm diseases recognised.
Growers contribute
Photos sent from the field feed the diagnosis and improve the models. The network learns.
Practices that converge
Comparing fields within a basin brings out best practices and the gaps to close.
Our agronomists alongside you
Training for your teams by Seabex agronomists. Local technical assistance and field coordination available on top.
Interpretation example
One field, two levels of reading
Each field gets a simplified interpretation for the grower, in their own language, and an expert interpretation for the advisor, each with matching recommendations.
Health score
45/100
Weather and soil DROUGHT
- Water balance
- -81,3 mm
- Rainfall
- 1,4 mm
- ET0
- 82,7 mm
- Dry days
- 15 days
What is happening in your field
Your field is going through a long dry spell: almost no rain for 15 days. The plants show early stress and are growing a little less. Good news: your soil holds water well at depth, which limits the damage.
Where to look
Lighter soil patches and field edges, where water shortage shows first.What we recommend
- No irrigation possible on this rain-fed field: focus on plant resilience.
- Apply a foliar biostimulant (seaweed extracts or amino acids) to help the plant cope with drought.
- Walk the sensitive areas within the next 7 days.
Example taken from a real interpretation, translated from Arabic. Advice is produced in the grower's language.
WHO IT'S FOR
One foundation, four uses
Challenge
Thousands of clients and members for one team of field sales advisors.
What Satellite Insights changes
Know which clients to call or visit this week. A dated record of every piece of advice, useful for traceability.
Result
More growers per advisor, better-targeted advice and stronger client relationships.
TRUSTED BY
Deployed across real value chains
Tunifert
186 farmers and 3,500 ha of wheat monitored by a team of agronomists. Satellite Insights diagnostics with risk scores per field and per farm, senescence and harvest-start detection, sensorless water balance estimate, multi-level dashboard.
Royal Plant · Tomato
Tomato production monitoring, scaling to 1,000 ha.
Sugar beet value chain
Digitalisation of a sugar beet value chain for sugar production, from field to factory.
Thousands of production cycles managed across field crops and vegetable crops, covering dozens of species. Netirrig by Seabex is prescribed by 18 Chambers of Agriculture.
OVER TIME
Every season makes the next one sharper.
Season 1
Build
- Field mapping
- Model calibration on your fields
- Dashboard set-up
Season 2
Operate
- Full platform from day one
- Scheduled analyses across the season
- Harvest detection live
Season 3
Compare
- Two seasons of history
- Year-on-year comparison
- Models refined on your soils
Season 4
Anticipate
- Consolidated multi-year history
- Risk situations anticipated
- Season data put to use
Set-up happens once. Its benefits compound.
Satellite Insights fits into the rest of your monitoring
Two distinct building blocks work together: agronomic models (soil-plant water balance, crop needs) and satellite remote sensing. Nothing to install on farms.
FAQ
Frequently asked questions
Give your field teams a head start.
Monitor your whole network. Act where it matters.