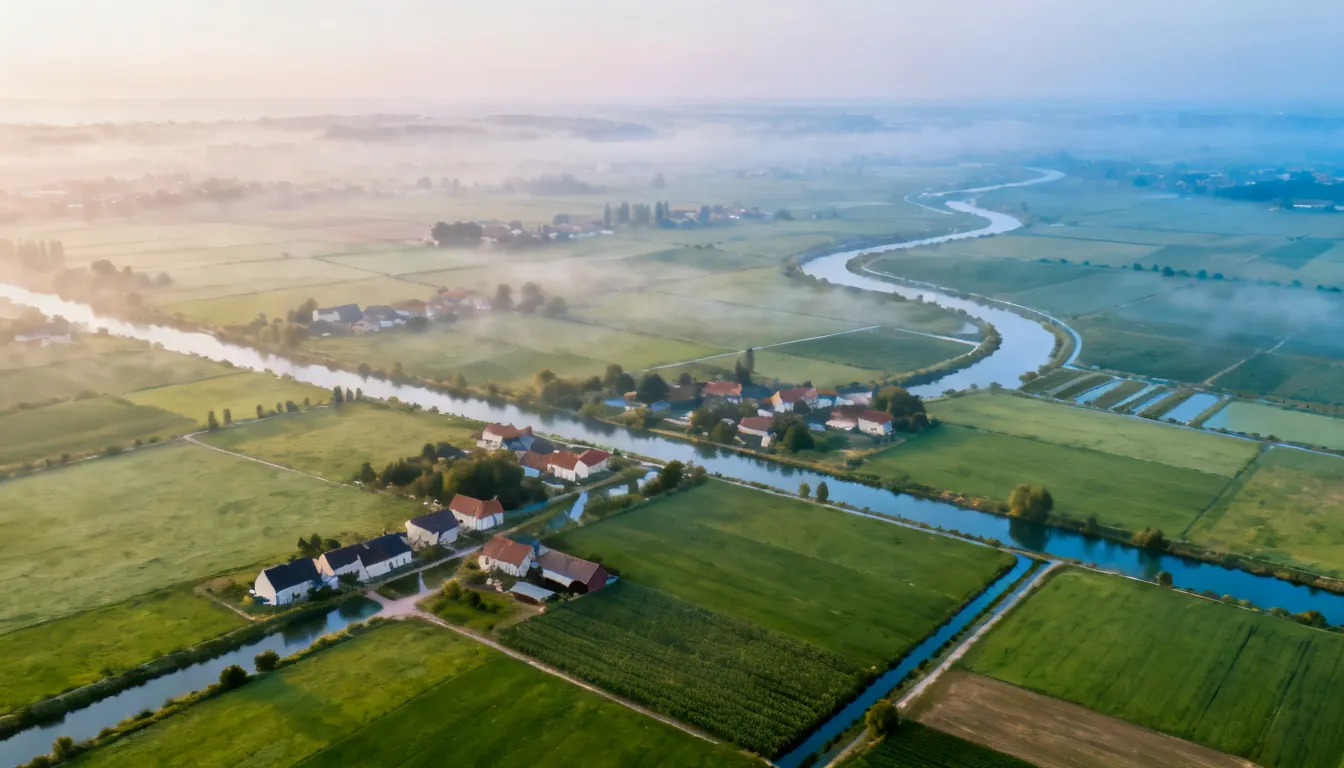
Aggregate and measure water across your entire supply chain
Your upstream agricultural water consumption is fragmented, declarative and not comparable today. Seabex measures it by satellite at field level and consolidates it by supplier, crop, basin and country.
Aggregation, the prerequisite to any water consumption reduction
You only reduce what you measure. Most agri-food supply chains know their scope 1 and 2 water footprint, but the agricultural scope 3 — often more than 80% of the total footprint — remains a blind spot. Supplier declarations are heterogeneous, sometimes missing, and allow neither comparison nor consolidation.
Per-field satellite measurement changes the game. By applying the same method to every supplier, crop and basin, you get a supply-chain water consumption that is comparable, time-stamped and reproducible. You identify gaps between suppliers, the most intensive crops, and stress-exposed basins.
Multi-year monitoring turns this data into proof. Real consumption decline is demonstrated over time, at the field as at the basin level — and provides the technical foundation to then structure an ESRS E3 water report that holds up to your statutory auditor.
From declaration to measurement
Why supplier declarations are not enough to pilot supply-chain water
Today
- Upstream data is declarative, heterogeneous, unverifiable
- Impossible to compare two suppliers on the same basis
- No reliable history to demonstrate a decrease
- No granularity by crop or watershed
With Seabex
- Customized recommendations per farmer, at field level, strengthening their capabilities, across the entire value chain
- Verification of declarations using satellite imagery, and our proprietary AI models, in addition to field verification
- Multi-level aggregation: supplier → crop → basin → territory → country
- Comparable, auditable multi-year history
How it works
From field to supply chain, in three steps
Per-field satellite measurement
Satellite imagery and agronomic AI compute a double-reservoir water balance at field level, without sensors installed at your suppliers.
Agronomic normalisation
Field evolution, agricultural practices and per-crop phenology make measurements comparable from field to field and supplier to supplier.
Multi-level aggregation
Consolidate by supplier, crop, watershed, territory and country — across 90,000+ ha under management in 6 countries by Seabex.
The Seabex platform in action
A complete agronomic view of your agricultural supply chain — in real time.
What you gain by aggregating
Comparable data, proof over time, a foundation ready for reporting.
Cross-supplier comparability
Spot water-efficiency gaps between suppliers on a homogeneous, independent basis. Engage your top partners, support the rest.
Proof of reduction over time
Demonstrate year over year the real decrease of your upstream water consumption, with a traceable multi-year history.
A foundation ready for reporting
Custom-built on a case-by-case basis, aggregated data directly feeds your sustainability report, indicator by indicator.
Field-level water balance
Every field, monitored and assessed in its own context
Soil, climate, crop and phenological stage: Seabex computes a soil–plant water balance for every field, using proven agronomic models (FAO-56, Penman-Monteith) coupled with field experimentation, AI adjustment and satellite imagery.
The field's real context
- • Soil texture and available water capacity (AWC)
- • Local climate: ET0, rainfall, temperature
- • Crop, sowing date, phenological stage
- • Agricultural practices and satellite observations
Industry-recognised references
- • FAO-56 — ETc = Kc × ET0
- • Penman-Monteith for reference ET0
- • Independently verified impact
- • Daily soil–plant balance (double reservoir model)
Comparable indicators
- • mm of water consumed (cumulative ETc)
- • Gap to optimum & water stress
- • Water efficiency (kg or € / m³)
- • Auditable water footprint per field
Take back control of your supply-chain water
Satellite-measured, comparable, reporting-ready.
FAQ