Satellite insights: why the invisible bands matter more than the image you see
In brief: an Earth observation satellite does not capture a single image — it captures around a dozen distinct spectral bands, most of which are invisible to the human eye. These invisible bands, particularly near-infrared, are what allow water stress on a crop to be detected before it becomes visible in the field. Aggregated over time and space, this data becomes a source of usable intelligence for farmers, agricultural cooperatives and the value chains that depend on them.
What a satellite actually sees
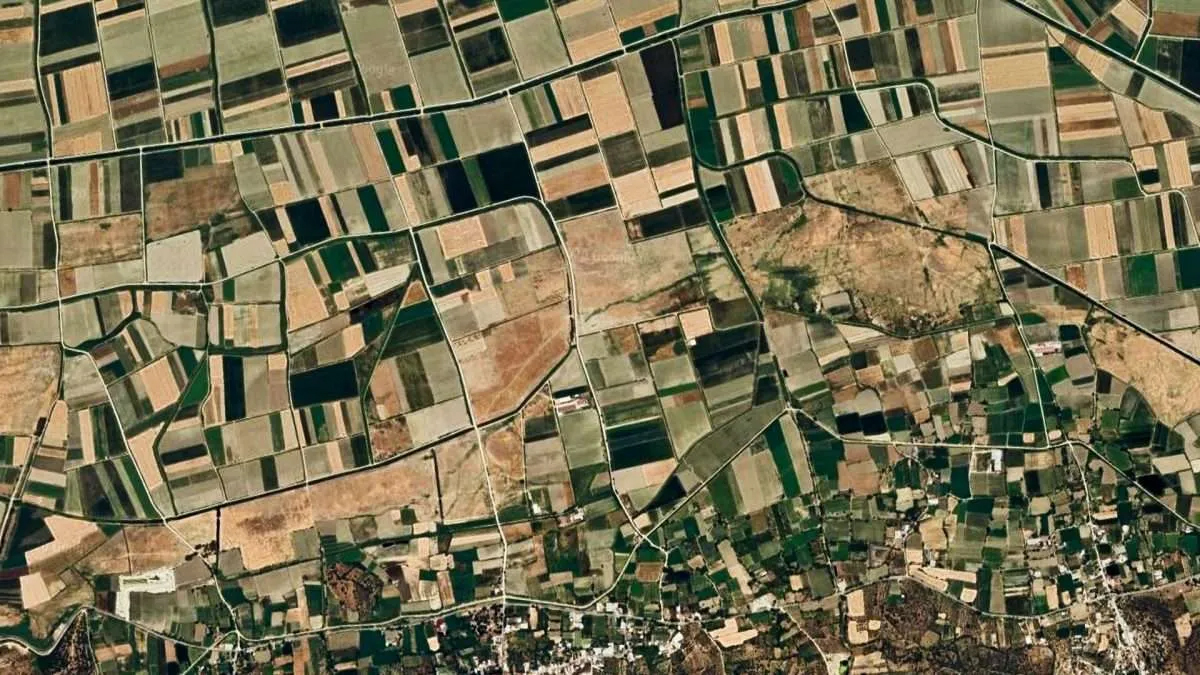
When people talk about satellite imagery in agriculture, they often picture a high-resolution aerial photo. That is not quite right. An observation satellite like Sentinel-2, operated by the European Space Agency, captures 13 spectral bands at resolutions of 10, 20 and 60 metres. Only three of those bands — red, green and blue — correspond to what the human eye perceives. The other ten sit in invisible wavelengths: near-infrared, short-wave infrared, and red-edge bands.
Each band captures a different physical property of the observed surface. It is this diversity that turns a satellite image into a measurement instrument rather than a simple photograph.
Why visible light is not enough
The human eye, like a standard camera sensor, only perceives light reflected between 0.4 and 0.7 micrometres. Chlorophyll in plant leaves strongly absorbs visible light in that same range for photosynthesis. A healthy leaf and a leaf in early water stress can therefore look almost identical in visible light, even though their physiological state has already diverged significantly.
The cell structure of the leaf, on the other hand, strongly reflects near-infrared light, between 0.7 and 1.1 micrometres. The more leaf area and biomass a plant develops, the stronger this near-infrared reflection becomes. This contrast between absorption in the visible range and reflection in the infrared is what makes vegetation identifiable and quantifiable from space, well beyond what a natural-colour image can show.
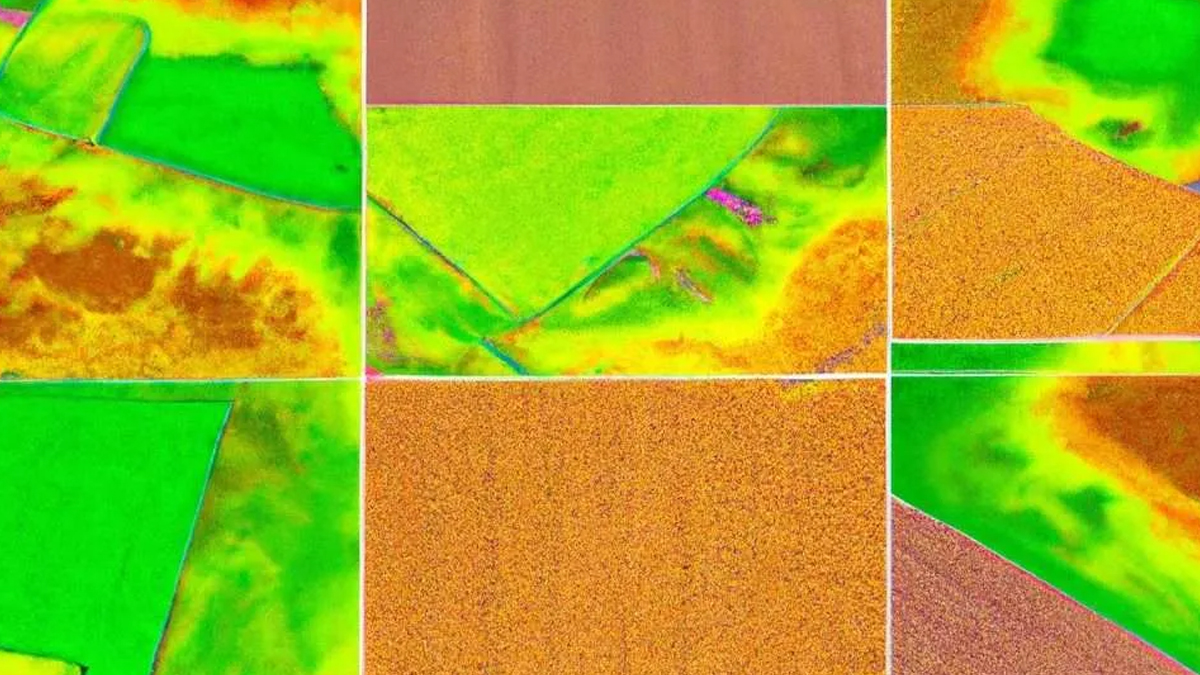
A field that looks uniformly green in a standard photo can reveal, once infrared bands are combined, distinct zones corresponding to irrigation differences or early-stage disease — simply invisible to the human eye in natural colour.
The physical principle behind vegetation indices
The most widely used index in precision agriculture, NDVI (Normalized Difference Vegetation Index), relies directly on this contrast. It is calculated as the ratio between near-infrared reflectance and red reflectance: NDVI = (NIR − Red) / (NIR + Red). Healthy vegetation, which absorbs red light and strongly reflects infrared, produces a high index value. Stressed, diseased or sparse vegetation reflects more visible light and less infrared, causing the index to drop in a measurable way.
This mechanism has a direct operational consequence for irrigation: leaves under water stress or disease turn more yellow and reflect significantly less in the infrared range, which makes the stress signal detectable before yellowing becomes clearly visible on the ground.
Other bands open up other diagnostics. Short-wave infrared (SWIR) bands, combined with each other, produce indices useful for drought monitoring and irrigation mapping. Red-edge bands, positioned at the boundary between visible and near-infrared light, go even further: research on wheat yellow rust has shown that combining red and red-edge bands can build a disease detection index with over 84% accuracy under controlled conditions, later validated against field survey data.
From spectral band to agronomic decision
No single spectral band, taken in isolation, means much to a farm director, a cooperative's technical manager, or a value-chain buyer. The value appears once these signals are aggregated: over time, to build a series that distinguishes normal seasonal variation from a genuine anomaly; across space, to compare a field against its neighbours or its own history; and across sensors, by combining optical data (Sentinel-2) with radar (Sentinel-1), which provides information independent of cloud cover.
This combination measurably improves diagnostic reliability. Crop mapping studies have shown that fusing radar and optical data can reach classification accuracies above 95%, and that adding red-edge and short-wave infrared bands further improves accuracy compared with using only visible and near-infrared bands.
It is this aggregation, not the raw satellite image, that constitutes usable intelligence: a water-stress threshold reached on a given field, a growth trajectory falling behind the regional median, an anomaly caught before it becomes costly. These are actionable signals, produced with no physical sensor in the field, at the scale of a single plot or an entire production basin.
Three levels of relevance, by stakeholder
For the farmer, this aggregation translates into a simple question: where and when to irrigate, based on a stress signal detected before yield loss sets in. Satellite data complements, rather than replaces, field observation.
For the agricultural cooperative, the value lies in scaling up: monitoring the water and health status of hundreds of member fields simultaneously, prioritising technical visits on at-risk zones, and documenting water savings in a standardised way across an entire territory rather than field by field.
For the value chain (processors, distributors, financiers, export supply chains), aggregating this data across an entire production basin makes it possible to anticipate volume or quality gaps ahead of harvest, and to document sustainability indicators (water consumption, irrigation practices) with a level of granularity and traceability that self-reported data alone cannot achieve.
What this changes in practice
The core takeaway fits in one sentence: the natural-colour satellite photo is the least informative part of the signal. Agronomic value is built in the invisible bands — near-infrared, red-edge, short-wave infrared — and in their coherent aggregation over time, across space, and across sensors. It is this data architecture, more than the resolution of any single image, that turns a raw physical signal into an irrigation decision, a prioritised intervention, or a reliable sustainability indicator for an entire supply chain.
At Seabex, this multi-band, multi-sensor aggregation architecture is the technical foundation of Satellite Insights, our module that analyses 31 spectral indices (Sentinel-1 and Sentinel-2, 10 m resolution, refreshed every 5 days) and automatically generates agronomic diagnostics and intervention recommendations across an entire farm or territory.
Frequently asked questions
What is a spectral band in satellite imagery? A spectral band is a precise range of wavelengths measured by a satellite's sensor. A satellite like Sentinel-2 measures 13, of which only 3 (red, green, blue) correspond to what the human eye sees.
Why is infrared more useful than visible light for agriculture? Because the cell structure of leaves strongly reflects near-infrared light, while chlorophyll absorbs visible light for photosynthesis. This contrast makes it possible to measure a plant's vigour and stress before any colour change is visible to the naked eye.
What is NDVI? NDVI is a vegetation index calculated from the ratio between near-infrared reflectance and red reflectance. A high value indicates dense, healthy vegetation; a low value signals stress, disease or sparse vegetation.
Can satellites detect water stress before it is visible in the field? Yes. Leaves under water deficit change their infrared reflectance before yellowing becomes visible to the naked eye, which allows early detection through remote sensing.
How is this technology useful to a cooperative or a value chain, and not just a farmer? Because it applies at the same scale as a satellite image: an entire production basin, regardless of the number of fields. A cooperative can prioritise its technical visits, and a value-chain actor can anticipate volume gaps or document sustainability indicators across a territory.
Voir comment Seabex applique ceci sur le terrain
Une démo de 20 minutes, adaptée à votre exploitation, votre coopérative ou votre filière.